Categories
Uncategorized

Data Handling

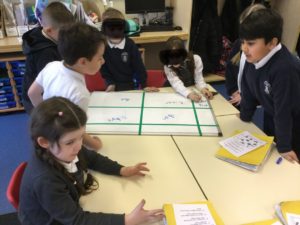
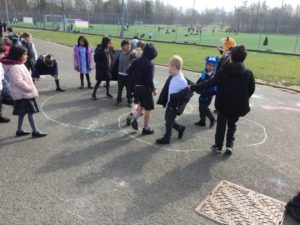
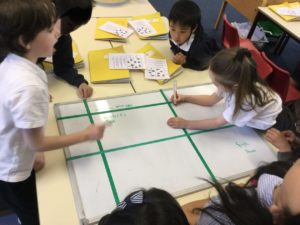
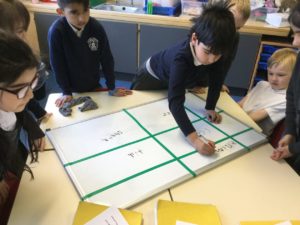
In Maths, we have been learning of interpret a range of a data. On Wednesday we took part in a human Venn Diagram. Today we looked at a Carroll Diagram and we enjoyed having a competition to come up with as many of our own ideas and answers for the set criteria.

Leave a Reply

Your email address will not be published. Required fields are marked *

Report a Glow concern
Cookie policy  Privacy policy

Glow Blogs uses cookies to enhance your experience on our service. By using this service or closing this message you consent to our use of those cookies. Please read our Cookie Policy.