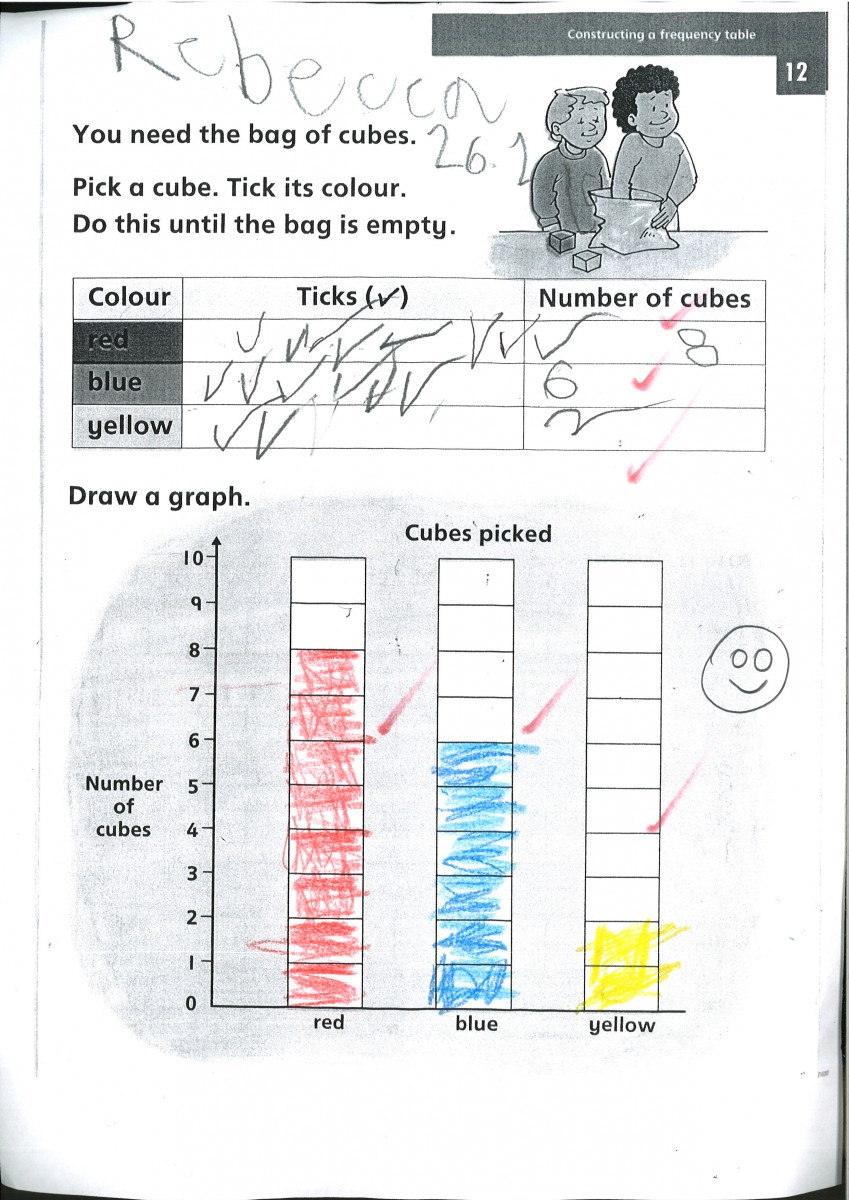
We have been learning to gather data using tally marks. We sorted the cubes by colours and recorded the information on a table. We then showed this information using a bar graph.
Rebecca successfully collected and displayed the data. Collecting data is a skill we will use in our future learning.