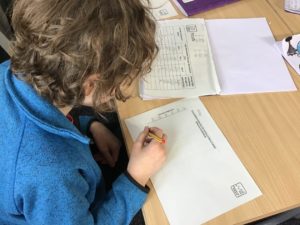
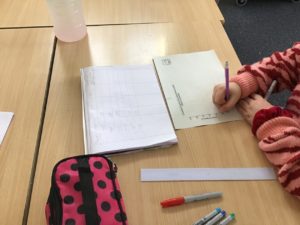
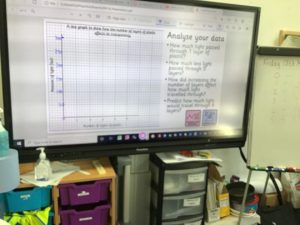
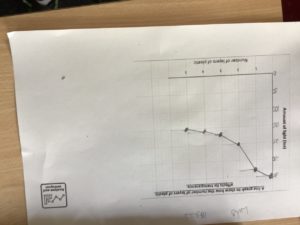
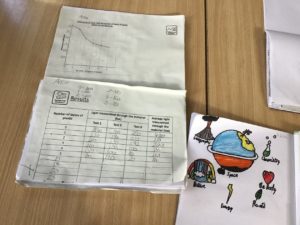
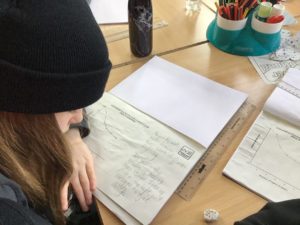
P7 calculated the mean average of their data sets then plotted a line graph showing the numbers of layers of plastic and the amount of light transmitted through the layers. They discussed the patterns and trends they saw.
P7 then predicted what would happen if they added another layer of plastic, drew conclusions and evaluated the odd results they got at times and the accuracy of their measurements.
