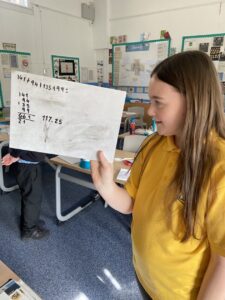
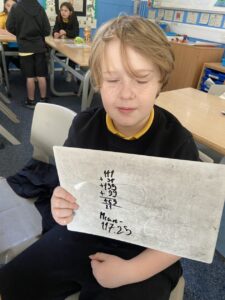
P4/5 have collected and collated data on food waste and transport in Fenwick Primary and they have created graphs to show the data in a variety of formats. We then calculated the ‘mean’of clean plates over 4 weeks.

P4/5 have collected and collated data on food waste and transport in Fenwick Primary and they have created graphs to show the data in a variety of formats. We then calculated the ‘mean’of clean plates over 4 weeks.