A Bar Chart is a type of graph that uses blocks of different heights to represent different values.
For example:
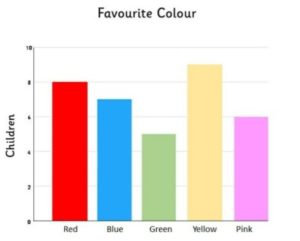
This Bar Chart shows the favourite colour of a group of children.
We can read from the chart that 8 children chose red as their favourite colour, 5 children chose green and 6 children chose pink.
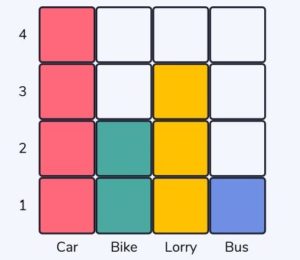
Just before Bar Charts are introduced, children may have used to Block Graphs which are a simpler version of Bar Charts. These are drawn on squared paper and each square or block represents 1.
CURRICULUM LINK:
I have explored a variety
of ways in which data is
presented and can ask
and answer questions
about the information
it contains.
MNU 1-20a
![]()
You may wish to find out more about
Line Graphs, Scatter Graphs, Pictographs