Mathematical Adventures of Music

Believe it or not, there are many mathematical concepts which permeate music. According to Rosenthal (2005) ‘Musical notations as octaves, chords, scales and keys can all be demystified and understood logically using simple mathematics’.

But how does music work? And where do maths and music meet?

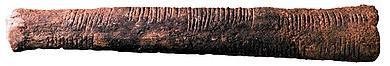
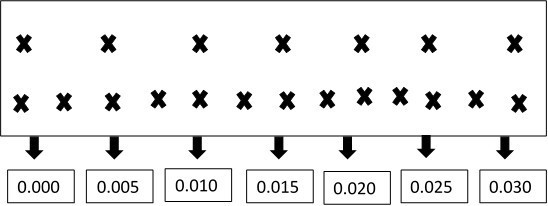
When a musical note is played for example, on a guitar, the string of the guitar vibrates. This gives off hundreds of tiny pressurised air pockets which travel through the atmosphere in waves of sound towards our ears. The air pockets then hit our ear drums, and create the musical sounds that we hear (Rosenthal, 2005).

Confused? Imagine this: 
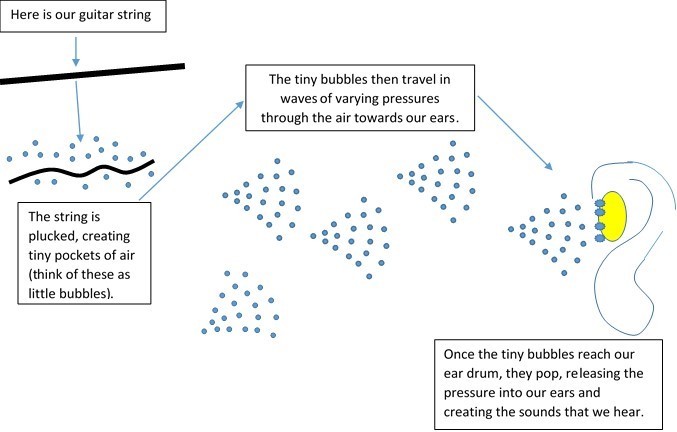
Air pocket waves

(Rosenthal, 2005)

If we put this into an example as highlighted by Rosenthal (2005), using the notes Middle C and Middle G just, we can further depict the mathematics involved. The blue note in this example is Middle C, and the yellow is G.

Keyboard

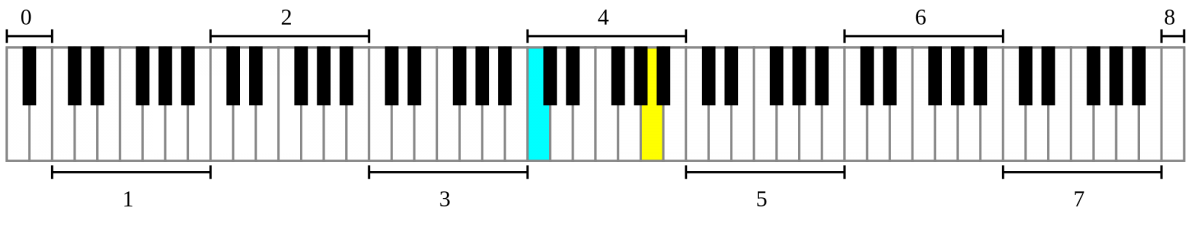
According to Rosenthal (2005) the C note ‘has a frequency of about 262 Hertz. That means that when Middle C is played, 262 pockets of higher air pressure pound against your ear each second’ (Rosenthal, 2005).

If we place this into a basic graph, it would look like this:
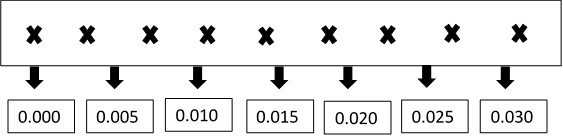
Middle C soundwaves

Seconds

(Rosenthal, 2005)

It is through using these graphs that we can depict the relationship between musical notes. If we take the frequency graph for note G and compare it to note C, we can see that the air pockets move at a faster pace for note G. This is because it holds a higher frequency of 392Hertz (Hz), creating a higher pitched note:
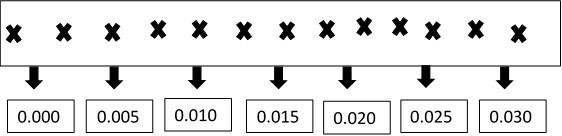
Middle G soundwaves

Seconds

(Rosenthal, 2005)

Rosenthal (2005) states that ‘by using knowledge of sound frequencies carefully, such musical mysteries as octaves and chords can be unravelled’ and this is where our mathematical adventure of music will take us next.

Using what we know about air pockets and frequencies, we are able to explain why certain notes sound good together and why certain notes do not. If we plot the notes C and G together on a frequency graph, it can be seen that the notes meet at regular intervals:

C and G soundwaves

Seconds

(Rosenthal, 2005).

Translated into a waves graph it looks like this: (Middle C: Orange) (G: Blue): C and G wave diagram

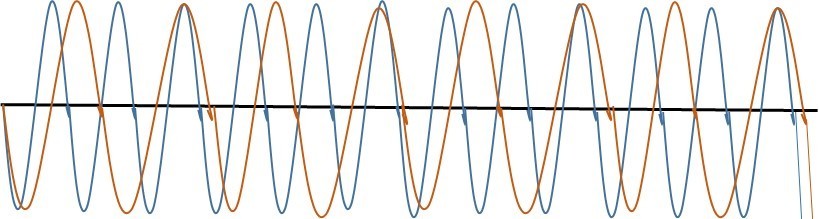
This graph shows the waves to meet on every 3rd G note and second C note soundwave. This equates to the ratio of 3/2, and this is what creates a sound that is pleasing to our ears. This is the case as the difference between the middle C note and the G note is only off by ‘0.0017’ seconds, creating a pleasing rhythm of air pockets which hit off of our ear drums (Heimiller, 2002).

This can be shown through an example taken from Heimiller (2002):

Heimller table

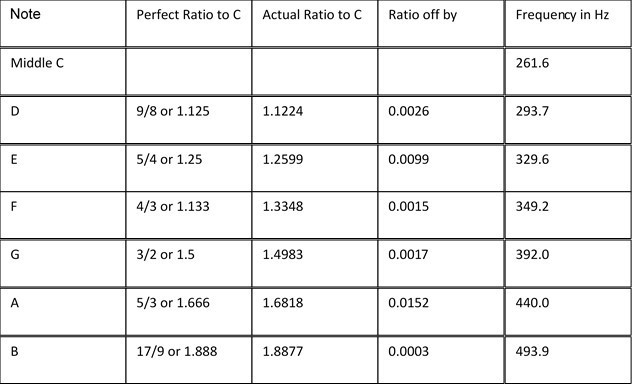
The ratios can be worked out using the information from the sound wave graphs. For example:

‘9/8’ can be equated into the sum:  9 divided by 8 = ‘1.125’.

(Heimiller, 2002)

This however, is an imperfect ratio as the numbers have been rounded (Heimiller, 2002). Although the reason why is not described, I beleive that a possible explanation could be as a result of the untraceable changes within the frequencies to the human ears as the air pockets are so tiny.

The further out the ratio from middle C, the more displeasing the rhythm of air pockets, creating what our ears hear as displeasing sounds. This can be represented through a sound wave graph which depicts the frequencies of the notes Middle C and A- the two notes with the highest difference in frequencies (Heimiller, 2002):

C and A wave diagram

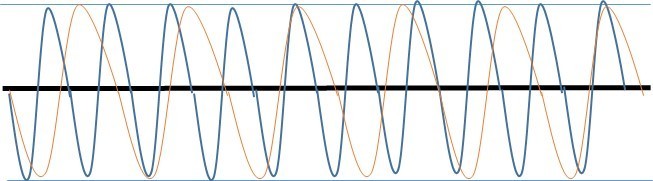
The notes repeat frequencies at less common intervals, creating a barrage of tiny air pockets which hit the ear in an unpleasing rhythm, this creates unpleasing sounds to our ears.

Links to fundamental mathematics and a wider world context:

Despite the topic of maths and music being quite confusing at times, the maths boils down to the basic principle of patterns. The smaller the difference in ratio of the air pockets, the more frequently the sound waves meet. This creates more repetition of frequencies within the notes, creating a sound which to our ears is similar, or which blends well together, for example in chords. The patterns created by the air waves, allows for similar notes to be put together. This can often be translated into patterns within musical pieces, as composers are more likely to put notes and phrases of music together within a piece if they sound pleasing together. This knowledge of music and musical notes has contributed greatly over the years to the way in which music is created. On a whole, composers will attempt to make music which at some point has repetition of either notes or phrases as it is pleasing to the ear, and could be said to be more likeable to listeners than music which follows no repetition.

Relation to Practice:

The basic principles of the maths behind music can also be related into teaching practice. I believe that this is possible through children’s engagement with different rhythms and beats within music. When learning about music, often one of the first things that children will look at is being able to follow a simple beat. This can be taken from basic repetition of the teacher clapping her hands to looking at beats and rests in music. This on a very basic form allows children to understand the process of patterns. This can be built up throughout music to look at timings in music, which are able to be broken down into fractions.


References:

Heimiller, J (2002) Where Maths Meets Music. Available at: https://musicmasterworks.com/WhereMathMeetsMusic.html (Accessed 19th November 2015).

Rosenthal, J (2005) The Magical Mathematics of Music. Available at:  https://plus.maths.org/content/magical-mathematics-music (Accessed 19th November 2015)


The Science of Shuffling

Seven Shuffles- the amount of shuffles said by Diaconis and Bayer to completely randomise a deck of cards. In particular, a set of cards which have been perfectly riffle shuffled (Eastaway, 2008, p44).

According to Eastaway (2008, p41) ‘a riffle shuffle involves cutting the pack into two roughly equal piles, then bending the piles up with the thumbs, bringing them together’.  There are many variations of riffle shuffle, but for the purpose of this blog post, I plan to relate to what is called a ‘perfect riffle shuffle’ (Eastaway, 2008, p41).

Within a ‘perfect riffle shuffle’ (Eastaway, 2008, p41), one whole deck of cards is divided equally into two piles of 26:

Riffle Shuffle Diagram

This can be carried out in two ways:

The first, is a ‘Perfect Out Shuffle’ (Eastaway, 2008, p42). This shuffle occurs from dropping the ‘bottom-half’ of the pack of cards first to create a mixed set of cards. This shuffle allows both the top and bottom card to stay in the same place (Eastaway, 2008, p42). This could be said to give a magician a strategical advantage for working out the location of other cards in the pack, and therefore the cards which you choose when playing.

The second is called a ‘Perfect In Shuffle’ (Eastaway, 2008, p42). It follows the same concept as previously, however it places ‘the card that was originally at the top of the pack’(Eastaway, 2008, p42) directly underneath the top one. The original bottom card is placed ‘second from the bottom’ (Eastaway, 2008, p42). This means that ‘the cards that were originally on the outside of the pack are now tucked inside’ (Eastaway, 2008, p42).

‘If you take a complete pack of 52 cards and out shuffle them (perfectly) exactly eight times, you will discover you have restored the pack exactly to the order that it was in when it started’ (Eastaway, 2008, p43). If you do it one less time, it could be said that the pack will end up completely randomised. However, it is important to be critical of this, as hardly anyone is able to achieve a perfect shuffle, giving variation to the results.


How does this knowledge link to maths?
Whilst knowing the perfect amount of times to shuffle a pack of cards may not be useful unless you are a magician, there is a distinct pattern which can be shown and predicted throughout the shuffling process. Eastaway (2008, p40) states that ‘in every game there is an element of finding patterns…but even more importantly there is an element of chance’, and this is why the example of playing cards resonates with me. When watching card tricks, I have always been in awe of how the magicians are able to guess your cards. I had always put this down to a lucky guess, but in fact there is a mathematical element of chance and probability behind the magic, and it comes in the form of shuffling a pack of cards and being able to predict which set of cards will end up where.

Mathematician and magician Persi Diaconis created a formula to define and prove the theory that if you shuffle a pack of cards using a basic riffle shuffle, then it will only need shuffled 7 times to have completely randomised the deck. This is the main formula used to describe the theory:

formula

Whilst this formula is resonant of an advanced understanding of mathematics, one which I don’t quite have a grasp of yet! (There is a paper in the references below if you fancy having a go at it yourself), it has highlighted to me in a rather unique way, why it may be useful to children to learn about the concept of chance and probability.

In a real world context, the theory can have negative implications for casinos as Persi Diaconis and Dave Bayer have proven (Eastaway, 2008, p44). This is because ‘after one, two, three shuffles, the original card pattern does begin to mix, but traces of the original order can still be spotted’ (Eastaway, 2008, p44). This provides people who are highly skilled in card play, the opportunity to track and more successfully win a game (Eastaway, 2008, p44).

Chance and probability play a large part in people’s everyday lives. It goes beyond a mathematical concept and trickles into everything that we do. This is why I believe that teaching children chance and probability is of key importance. Life is not one linear predictable process it changes constantly. It is important for children to learn this, and on a very basic level, it could be argued that learning this in school begins to build the foundations of children’s understanding of the world. According to Askew and Eastaway (2013, p260) ‘we are surrounded by uncertainty, and being able to cope with events that are not entirely predictable is one of the most important life skills’.  This highlights the importance of learning chance and probability in order to navigate the world around us.


References:

Askew, M and Eastaway, R (2013) Maths for Mums and Dads; Take the pain out of maths homework. London: Square Peg.

Eastaway, R (2008) How many socks make a pair? Suprisingly Intersesting Everyday Maths. London: CPI.

Persi Diaconis (N.D) Mathematical Developments from the analysis of riffle shuffling. Available at: http://statweb.stanford.edu/~cgates/PERSI/papers/Riffle.pdf

(Accessed 15th November 2015)


Tesselation, Angles and Escher

According to the University of Leeds International Textiles Archive (ULITA)  (N.D., p2) ‘Symmetry…is possibly the most significant and elegant connection that transcends the boundaries between art, science and mathematics’. One of the most poignant examples of this is the usage of symmetry in ‘repeating patterns and tilings’ (ULITA, N.D., p2). Using the concept of symmetry, a wide range of designs and patterns can be created, and they are used throughout society (ULITA, N.D., p2).

Symmetry however, is not only present in man-made creations, it is also present throughout ‘nature’ (ULITA, N.D., p10) and can be found almost anywhere. The ULITA state that ‘it can be seen for example in the symmetrical shapes of flowers, in the hexagonal pattern of beehives and in the spiral of a pine cone’ (ULITA, N.D., p10).

5468395253_66866a0ab1                    Plant_Tessellation                  tesselated Beehive

Snake Skin- Hexagons                    Cactus Leaves- Triangles                Beehives- Hexagons

The symmetry involved within the pictures is clear to see. Each shape is equal to one another, and each shape fits perfectly with the next to create a network of patterns, but how do these shapes fit so tightly together?

The answer: Tesselation

All of the shapes highlighted in the pictures above have one thing in common, they all hold an individual inner angle which is equal, and all of the equal angles add up to 360 degrees. This is the only way in which a tessellation can occur (ULITA, N.D, p13).

The basic tessellation of an equilateral triangle: (Information citation: Harris, 2000, p6)

Triangles 2

The diagram above shows that if you have ‘6 complete equilateral triangles’ (Harris, 2000, p6) it is possible for all of the triangles to meet at one vertice. This is because all of the internal angles within the triangles are whole numbers, allowing them to be divided exactly into 360. This creates no remainders, which means that there are no possible gaps between the shapes (Harris, 2000, p6). This is what allows tessellation to occur (Harris, 2000, p6).

The links to MC Escher:

Mc Escher was a graphic artist trained at the ‘Haarlem School for Architecture and Decorative Arts’ (Pitici, 2012, p122). His work was greatly influenced by geometry and shapes, and he translated this influence to depict nature in a geometric way; ‘Escher’s tile shapes (which he called ‘motifs’) had to be recognizable (in outline) as creatures’ (Pitici, 2012, p123).

His work took the basic concepts of tessellation as discussed above and adapted it to create more complex designs (Harris, 2000, p18). According to Harris (2000, p18) ‘it is possible to produce some very regular shapes which will tessellate by transforming other shapes which are known to tessellate’ (Harris, 2000, p18). This is done through a cutting and pasting process of normal shapes which tessellate and ‘translating or rotating’ (Harris, 2000, p18) them to create ‘a new, irregular shape’ (Harris, 2000, p18).

Here is a famous example of his work:

Lizards Escher Pic


All of the images fit together in tessellation, this is as a result of tangents. A tangent is a line which can be used to identify the points where a shape could touch a flat surface (BBC Bitesize, 2014). As long as the tangents of these shapes add up to 360 degrees, then the process of tessellation can occur (Harris, 2000, p19).

Each of Escher’s Lizard shapes are formed from a hexagon, all of which are fitted together to create a grid. Escher takes each hexagonal shape and follows a sequence of either ‘translating (sliding)’ (Harris, 2000, p18) a section of the shape ‘to the opposite side’ (Harris, 2000, p18) using the tangents of the angles, or through ‘rotating it about the midpoint’ (Harris, 2000, p18) of the tangent of the shape to create his lizards. (Harris, 2000, p18):

(Giganti, 2010).

This is how Escher was able to create his designs.

My Interpretation: Escher as a facilitator of learning in the classroom:

My engagement with this topic has highlighted to me a number of ways in which I could now approach the topic of angles and create cross-curricular links through MC Escher. I could approach the topic of angles in mathematics and link it shapes, allowing the children to explore different shapes and angles, and build a strong understanding of how this works. I could then develop it on to look at symmetry, shapes and angles. The children could look into the influences of angles in nature, and this could be further developed to link into the researching of McEscher and his background. Having done this, the children could be introduced to the process of tessellation and could create their own, measuring shapes and creating simple tessellations. This could be differentiated if appropriate to include the translation and rotation of sections of shape to create either one tessellated shape, or a series of tessellated shapes, much like Escher. It may also be linked to IT through looking at planning of artistic designs using computer programmes.

References:

BBC Bitesize (2014) Circles-Higher. Available at: http://www.bbc.co.uk/schools/gcsebitesize/maths/geometry/circles2hirev9.shtml (Accessed 13th November 2015)

Harris, A (2000), The mathematics of Tessellation. Available at: http://ictedusrv.cumbria.ac.uk/maths/pgdl/unit9/Tessellation.pdf (Accessed 12th November 2015)

Paul Giganti (2010) Anatomy of an Escher Lizard. Available at: https://www.youtube.com/watch?v=T6L6bE_bTMo (Accessed 13th November 2015)

Pitici, M (2012) The Best Writing on Mathematics. Available at: http://web.a.ebscohost.com.libproxy.dundee.ac.uk/ehost/ebookviewer/ebook/bmxlYmtfXzM5NDI0NV9fQU41?sid=7516a763-2c43-47b3-8f5a-19eddb8c94ac@sessionmgr4005&vid=1&format=EB&rid=1 (Accessed 13th November 2015)

University of Leeds International Textiles Archive (ULITA), N.D. Form, shape and space: An exhibition of tilings and Polyhedra: Teachers Booket. Available at: http://ulita.leeds.ac.uk/files/2014/06/Teachers_booklet.pdf (Accessed 12th November 2015)

Pre-Historic Maths: Yes, it’s really that old !

Within this blog post I will be making a whistle stop tour around three schools of thought on the origins of mathematics. 

Maths has been in many people’s lives for as long as they can remember. It features in almost everything that we do and can be interpreted in many different ways. But what was the first ever maths recorded and what did humans use it for?

Mathematics and the Ishango Bone:

According to Zaslavasky, one of the most intriguing mathematical finds to ever be made about the pre-historic world was ‘a carved bone discovered at the fishing site of Ishango’ in Africa (Zaslavosky, 1999, Ch.2). It is said to be from ‘between 23,000 and 18, 000 B.C.’ (Zaslavosky, 199, Ch.2) and is one of the earliest representations of maths known to date.

Here it is ! The Ishango Bone:

bonea


ishango_bone descriptor

Dr Jean Heinzelin:

Dr Jean Heinzelin believes that the bone was ‘used for engraving of writing’ (Q) (Zaslavasky, 199, Ch.2). It can be seen on the bone that ‘there are three separate colunms, each consisting of a set of notches arranged in distinct patterns (Zaslavasky, 1999, Ch.2).

The first column on the right hand side of the right bone, follows a pattern of ‘eleven, thirteen, seventeen and nineteen notches’ (Zaslavasky, 1999, Ch.2) linking to ‘the prime numbers between ten and twenty’ (Zaslavasky,1999, Ch.2).

The second column has a pattern of ‘10+ 1, 20+1, 20-1, and 10-1’ (Zaslavasky, 1999, Ch.2), showing an attempt to relate to a potential base 10 system.

The third shows the numbers to be ordered into ‘eight groups in the following order: 3, 6, 4, 8, 10, 5, 5, 7’ (Zaslavasky, 1999, Ch2). This is suggested to replicate an attempt to double (Zaslavasky, 1999, Ch.2).

This shows the Ishango bone as the first attempt to use a number system to record information and the beginning of an understanding of the way in which numbers work- maths at its most simplistic level.

Alexander Marshack:

Having investigated the bone on a more detailed level, he described the bone as something which ‘represents a notational and counting system, serving to accumulate groups of marks made by different points and apparently engraved at different times’ (Zaslavasky, 1999, Ch2).

His theory depicted the concept of the markings being a simple relation to what we now know as the ‘lunar model’ or lunar calendar (Zaslavasky, 1999, Ch.2).

It was backed-up by plotting ‘the engraved marks on the Ishango bone against a lunar model’ (Zaslavasky, 1999, Ch2). This showed a strong correlation ‘between the groups of marks and the astronomical lunar periods’ (Marshack, p30. The roots of civilization as cited in Zaslavasky, 199, Ch.2).

This is described by Zaslavasky (1999, Ch,2) as ‘evidence of one of man’s earliest intellectual activities, sequential notion on the basis of a lunar calendar, comprising of almost six months’.

Plester and Huylebrouck:

Plester and Huylebrouck support Marshack’s theory in relation to the fact that ‘present day African civilisations use bones, strings and other devices as calendars’ (Plester and Huylebrouck, 1999, p340), proposing the idea that maths was first used to chart the passing of time in monthly cycles.

However, they believe that ‘no awareness of the notion of prime numbers has been discovered before the classical Greek period’ further promoting the idea that Heinzelin is applying a modern approach to mathematics to a more simplistic ancient concept.

Plester however believes ‘that the ancient people of Ishango made use of thee bases 3 and 4 for counting and building further small numbers up to 10’ (Plester and Huylebrouck, 1999, p342) opposed to a system which used a base 10 system. This could mean that humans were able to chart time up to a base 12 system, not base 10.

My interpretation: Marks as symbols of number:

According to Cockburn and Haylock ‘there is a sense in which mathematical symbols…are abbreviations for mathematical ideas or concepts’ (Cockburn and Haylock, 2010, p13). When we are dealing with a number system, for example a base 10 system, each number along the line represents a symbol of measurement much like ‘the point on a number line’ (Q) (Cockburn and Haylock, 2010, p15). Each point on the number line represents one of something. If the Ishango bone was being used as a measurement of the lunar cycle, as highlighted by Marshack, it could be said that each mark (symbol) was a representation of one ‘unit’ (the units in this case being days). One symbol= one day. This would show the Ishango bone as a pre-historic representation of recording numerical information, much like the modern day base 10 system which is used to record information today.

References:

Haylock, D and Cockburn, A (2010) Understanding Mathematics for Young Children. 4th Ed. London: Sage.

Pletser, V and Huylebrouck, D (1999) The Ishango Artefact; the Missing Base 12 Link. Available at: http://www.scipress.org/journals/forma/pdf/1404/14040339.pdf (Accessed 8th November 2015).

Zaslavsky, C (1999) Africa Counts: Number and Pattern in African Cultures. 3rd Ed. Available at: https://books.google.co.uk/books?hl=en&lr=&id=2zanfxcor8UC&oi=fnd&pg=PT12&dq=number+origion+ishango+bone&ots=IT9T78xXM7&sig=iHdv22d_-_CDxRQfYl7tCNDDAgM#v=onepage&q&f=true (Downloaded 8th November 2015)

Oh no- not maths !

“Oh-no, not maths” a thought that often passes through my mind when maths is mentioned. As part of my professional development this year, I have decided to tackle my ultimate fear of maths, and it starts here ! Hopefully, I can prove to myself, and you too, that maths really can be done by anyone.

To start the ball rolling, this blog focuses on the concept of maths anxiety, and how it may translate into the classroom, and our own lives as practitioners too.

When people think of maths, I am sure that some of these images come to mind:

Anxiety 1 Math-Anxiety 2  math-anxiety 3

Many people may feel that they are alone in this fear, but the concept of maths anxiety is becoming more widley recognised within education. According to the Nuffield foundation (2015) maths anxiety is “a feeling of tension and anxiety that interferes with the manipulation of numbers and the solving of mathematical problems in ordinary life and academic situations”. It can occur at anytime, and may even influence the career path that people choose to follow.

But how does this relate to the classroom envrionment? The acknowledgement of my own maths anxiety has opened my eyes to how pupils may feel within a maths class. It has also allowed me to reflect on my future practice as a practitioner, in particular how I plan to use teaching methods to engage and relate to children who may also lack confidence when engaging with maths.

I hope to do this through allowing children to have time to think about their answers, sharing thier ideas with their peers. I beleive that this can allow the child to enitially present and experiment with their idea in a safe environment. Discussing their thoughts with another person may allow them to validate the idea within themselves, building their confidence and lowering the stress that they may feel in regards to answering a question.

Splitting the children into different coloured groups and providing the children within each group number cards from one to five, may also make children feel more at ease. When asking for answers to questions, you may ask for e.g. number five from each group to give a response following discussion. In doing this the children are able to identify five other people who are in the same position as them, and this may put them at ease, realising that there are other people who may also be feeling how they are feeling.

My introduction to maths anxiety and recognising that it is something that everyone experiences in their own way, has already lowered the negaitivity that I feel towards the subject.  It is okay to be anxious about mathematics, in fact it may event put you in a better position to learn it. Acknowledgement of your fear is the first step into the wonderfuld world of mathematics, and my journey starts here.

References:

http://www.nuffieldfoundation.org/understanding-mathematics-anxiety

http://blog.mylifetips.net/math-anxiety/

http://edielovesmath.net/math-anxiety-look-like-teens-young-adults-adhd/

https://moodle.kincaidweb.com/mod/forum/discuss.php?d=260

 Pictures: (In order left to right)

http://blog.mylifetips.net/math-anxiety/

http://edielovesmath.net/math-anxiety-look-like-teens-young-adults-adhd/

https://www.panicaway.com/word/free-audio?hop=stingnexus